Analysis
Case Study: Ford Green Bond Impact Analysis
How ClimateAligned transforms complex impact calculations
Nov 11, 2024 @ London
This case study examines how ClimateAligned's technology transforms complex, document-based reporting into streamlined, standardised metrics that enable genuine comparison and aggregation across holdings.
For asset managers and sustainable finance professionals, a persistent challenge exists in the green bond market: standardising impact metrics across diverse portfolios. While issuers typically provide detailed impact reports, these documents rarely present data in consistent formats or with the specific metrics investors need for portfolio-level analysis.
This case study examines how ClimateAligned's technology transforms complex, document-based reporting into streamlined, standardised metrics that enable genuine comparison and aggregation across holdings.
 Source: ClimateAligned Data, 2024
Client Scenario: Analysing Ford's Green Bond Impact
A sustainable fixed income manager needed to integrate Ford's green bond impact data into their portfolio-level carbon avoidance reporting. The manager faced a common dilemma: Ford's comprehensive 2023 Impact Report contained detailed information on their November 2021 green bond, but not in the format required for the manager's standardised reporting.
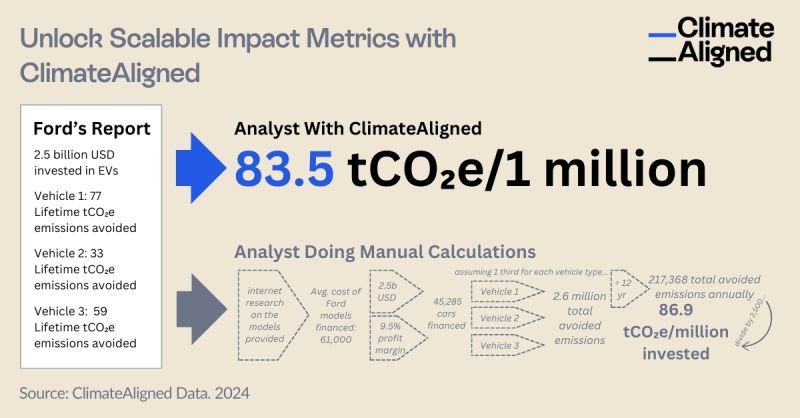
The Ford report highlighted:
- $2.5 billion USD invested in electric vehicle development and production
- Detailed lifetime CO₂e emissions avoided for three vehicle types (77, 33, and 59 tCO₂e respectively)
- Total number of vehicles financed through the bond allocation
While these metrics demonstrated clear environmental impact, they lacked the standardised annual CO₂e avoided per dollar invested metric that the asset manager needed for portfolio-wide benchmarking.
The Manual Process: Time-Intensive and Error-Prone
Without ClimateAligned, the analyst's process involved:
- Searching the internet for technical specifications on each Ford vehicle type
- Estimating average costs of Ford models financed
- Calculating the number of each vehicle type produced with the bond allocation
- Determining the expected lifetime for each vehicle
- Converting lifetime emissions avoidance to annualised figures
- Calculating the total annual emissions avoided
- Dividing by the total investment to determine tCO₂e avoided per million USD
This manual process required approximately 2-3 hours per bond, making it impractical for managers with dozens or hundreds of holdings. Furthermore, the subjective assumptions made during calculation created inconsistencies in how different analysts might evaluate the same bond.
The ClimateAligned Solution: Standardisation at Scale
Using ClimateAligned's technology, the same analysis was completed in minutes. The platform:
- Extracted the relevant data points from Ford's impact report
- Applied standardised conversion factors based on the project location (USA)
- Incorporated vehicle production data and expected usage patterns
- Applied consistent methodologies for annualising lifetime emissions avoidance
- Generated a standardised metric: 83.5 tons CO₂e avoided per million USD annually
To validate this approach, ClimateAligned's results were compared with a detailed manual calculation performed by the client's team. The manual process yielded 86.9 tCO₂e/million, a difference of less than 5% from ClimateAligned's automated calculation, confirming the platform's accuracy.
Key Benefits: Beyond Time Savings
While efficiency gains were substantial, the client identified several additional benefits from implementing ClimateAligned's approach:
Portfolio-Wide Comparability: For the first time, the manager could directly compare the impact efficiency of Ford's green bond against others in their portfolio using a consistent methodology.
Enhanced Reporting Capabilities: The standardised metrics enabled the creation of portfolio-level impact dashboards that previously had been impossible to generate.
Data Verification: The platform provided an independent verification of issuer-reported impacts, adding a layer of validation to the manager's due diligence process.
Strategic Allocation Insights: The ability to quickly compare impact efficiency across different bonds informed the manager's decisions about future portfolio construction to optimise both financial and environmental returns.
Scaling Impact Analysis Across the Portfolio
Following the successful analysis of Ford's green bond, the asset manager expanded the approach across their entire sustainable fixed income portfolio. ClimateAligned's technology has now processed over 3,000 impact reports, creating a consistent database of standardised metrics.
This comprehensive approach has transformed the manager's reporting capabilities, enabling them to:
- Provide clients with precise portfolio-level impact metrics
- Compare performance against benchmark indices
- Identify the highest-impact allocations within their portfolio
- Meet increasingly stringent regulatory reporting requirements
- Support engagement activities with issuers on impact reporting practices
Conclusion: Transforming Data into Insights
The Ford case study demonstrates how ClimateAligned transforms complex, inconsistent reporting into actionable, standardised metrics. By automating the calculation of annual CO₂e avoided per million dollars invested—even when issuers don't explicitly provide this figure—the platform enables asset managers to scale their impact analysis across entire portfolios.
This capability is becoming increasingly crucial as sustainable fixed income markets mature and both investors and regulators demand more rigorous, comparable impact reporting. Asset managers leveraging technologies like ClimateAligned gain a significant advantage in their ability to demonstrate the environmental impact of their investments with precision and confidence.
ClimateAligned provides automated impact calculation and standardisation for green, social, sustainability, and sustainability-linked bonds. Our platform has processed impact data from over 3,000 reports, enabling asset managers to scale their impact analysis and reporting.