Analysis
Estimating Solar Impact: Applying the Green Bond Impact Methodology
A standardised approach for measuring environmental benefits of solar investments in green bonds
Mar 19, 2025 @ London
Solar power represents a significant portion of green bond allocations, yet inconsistent impact reporting makes environmental assessment challenging for investors.
The green and sustainable bond market faces a critical challenge: inconsistent impact reporting. Issuers take wildly different approaches to measuring and attributing environmental impact - some report precise metrics for individual projects, others bundle impacts across their entire portfolio across unclear time frames, and many fall somewhere in between with partial or inconsistent data. This inconsistency makes it extraordinarily difficult for asset managers to accurately assess and report environmental impact of their investments.
ClimateAligned's Green Bond Impact Methodology offers a solution to this problem by transforming diverse impact reports into comparable datasets. At its core is a universal metric: annual greenhouse gas emissions avoided per million USD invested (tCO₂e/$1M). This approach enables direct comparison across bonds regardless of size, currency, or project type, while adhering to market standards for climate impact assessment.
Solar Impact Estimation
Solar power represents a significant portion of green bond allocations globally. Let's examine how to apply the standardised methodology to estimate solar project impact.
The Solar Calculation Formula
According to the methodology, solar impact is calculated as:
[Country's MWh/$1M] × [Country's electricity carbon intensity in CO₂e/MWh] = CO₂e/$1M
This formula takes into account two crucial factors:
- Energy generation potential: How much electricity a solar installation can produce per $1M invested in a specific country
- Grid carbon intensity: How carbon-intensive the local electricity grid is, which determines how much carbon is avoided when solar power replaces conventional generation
Country-Specific Factors
What makes this methodology particularly robust is its consideration of local conditions:
Solar Capacity Factor
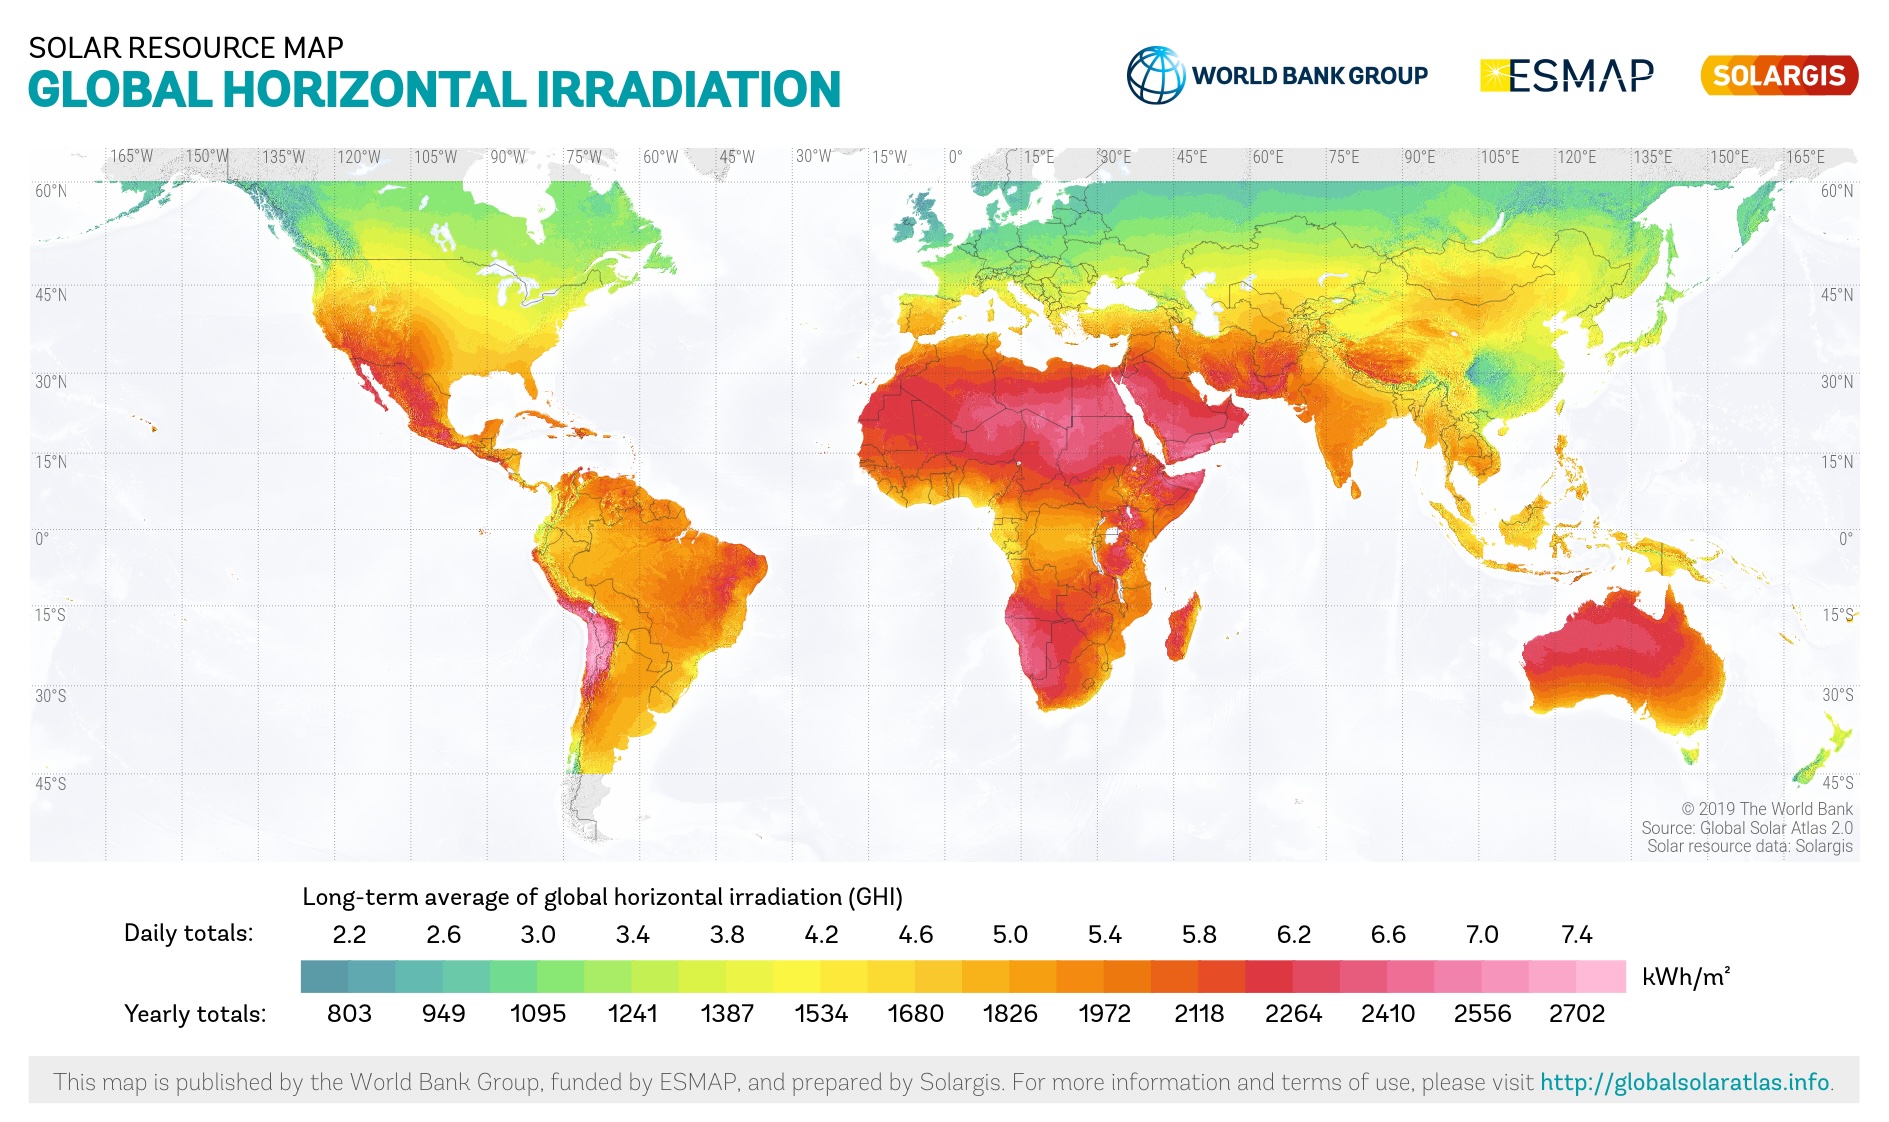
The capacity factor varies significantly by geography, based on:
- Local solar irradiance (how much sunlight hits the area)
- Seasonal variations
- Local weather patterns
The methodology references the World Bank PV Potential Data to determine country-specific capacity factors. For example, the document notes that capacity factors can vary considerably:
- India: 0.22
- USA: 0.20
- Norway: 0.11
Installation Costs
The methodology assumes 0.957 MW of solar capacity can be installed per $1M (as of 2024, according to Energy Intelligence). This figure helps standardise calculations across different markets and project sizes.
 Source: WorldBank
Practical Example
Let's walk through a real example from the Tatra Banka case study in the methodology:
- Energy Generation: 1,184.6 MWh/$1M (based on Slovakia's solar potential)
- Grid Carbon Intensity: 0.142 tCO₂e/MWh (Slovakia's grid carbon intensity)
- Impact Calculation: 1,184.6 MWh × 0.142 tCO₂e/MWh = 168.13 tCO₂e/$1M
This means that for every million dollars invested in solar projects in Slovakia, approximately 168.13 tonnes of CO₂ equivalent emissions are avoided annually.
Within the context of Tatra Banka's €200 million green bond, solar represented 5.4% of the total allocation, contributing significantly to the bond's overall environmental impact.
The Importance of Consistent Methodology
The solar example demonstrates how this approach creates a standardised framework that can be applied across diverse reporting formats. By deriving the specific projects financed by each bond by allocation and their geographic locations, and applying consistent assumptions, baselines, and business-as-usual scenarios, we convert varied reporting formats into actionable insights.
For asset managers and sustainability professionals seeking to evaluate solar investments, this methodology offers several key advantages:
- Comparability: Direct comparison of solar investments across different geographies and issuers
- Transparency: Clear definition of assumptions and calculations
- Consistency: Unified approach to measuring impact regardless of issuer reporting format
- Geographical sensitivity: Accounts for local conditions that significantly impact actual emissions avoided
Conclusion
The Green Bond Impact Methodology addresses the critical challenge of inconsistent impact reporting in the green bond market. By providing a standardised approach to estimating solar impact, this methodology empowers investors to make informed decisions based on comparable environmental data.
As the green bond market continues to grow, such standardised approaches will be essential for ensuring capital flows toward truly impactful projects and preventing greenwashing through inconsistent or opaque reporting methods.
Sources
The methodology draws on multiple sources to ensure robust calculations:
- World Bank PV Potential Data (for country-specific solar capacity factors)
- Energy Intelligence (for installation cost benchmarks)
- Energy Institute Statistical Review (for grid carbon intensity values)
- IRENA (2023) (for renewable energy cost benchmarks)
ClimateAligned's methodology provides a standardised approach to impact calculation, enabling direct comparison across diverse green bond investments regardless of issuer reporting formats.